Moving Averages: Boost Your Crypto Trading Skills with

When it comes to the thrills of crypto trading, the moving averages reigns as a critical tool. Whether you’re a seasoned trader or just starting out, understanding this fundamental concept can vastly improve your strategy. This article offers a comprehensive exploration of moving average, pinpointing the importance they bring to the world of crypto trading.
Firstly: what is a moving average? Technically speaking, a moving average is a statistical calculation employed to analyze data points by creating a series of averages from different subsets of the full data set. If we break down this definition: it’s essentially the art of smoothing out data to comprehend the underlying trends. In the realm of cryptocurrency, moving average function as a beacon, cutting through the noise of short-term price fluctuations to spotlight longer-term market direction.
Let’s ponder over a simple illustration:
“Consider that you’re tracking the daily price of a particular cryptocurrency for a period of five days. The prices over these days are $10, $11, $12, $12, and $14. Let’s calculate the moving average. To do this, you’d add all five prices together ($59) and then divide by the number of days (5). The result is a moving average of $11.80.”
That’s the essence of a moving average. Now, let’s delve into the different types of moving averages: Simple Moving Average (SMA), Exponential Moving Average (EMA), and Weighted Moving Average (WMA).
Table of Contents

Understanding the Moving Average: A Key Tool for Crypto Traders
In the world of crypto trading, participants primarily share a common aim: optimally timing the purchase or sale of a cryptocurrency to maximize return on investment. To achieve this, numerous tools and indicators are utilized, offering insight into market trends, behaviors, and potential future outcomes. Among them, one particularly powerful tool stands out: the moving average.
The moving average is a commonly used indicator in crypto trading. Its primary function is to smooth out price data and create a flowing line that traders can use to identify the direction of an asset’s trend. The moving average is a trend following, or lagging, indicator because it is based on past prices. This concept may seem simple at first glance, but it is essential to understanding the shifting sands of the crypto trading market.
This statistical tool, which uses the average of a specific set of data points over a given period to generate a value, presents a more balanced view of price trends by mitigating the impact of short-term price fluctuations. In essence, it is a method that helps traders validate existing market trends, anticipate future ones, and avoid deception by market noise.
Whether you are a seasoned trader or a newcomer to the crypto world, understanding moving averages can significantly enhance your trading strategies. It can mean the difference between making a profitable investment and a less satisfactory one, as it provides a clearer picture of the market’s behavior beyond day-to-day price movements.
The moving average is not a standalone tool, but rather a valuable feature in any trader’s toolkit. Combined with other market indicators, it can greatly contribute to timely and efficient decision-making, augment the trader’s strategic arsenal, and maximize profit margins.
Delving deeper into the mechanics and applications of moving averages can indeed seem daunting for novices. However, the effort can prove to be a worthy investment of time and brainpower. After all, crypto trading, like any form of trading, is a game of strategy, knowledge, and understanding.
What is the Moving Average and Why Does it Matter?
The moving average, as the name suggests, is simply an average that moves. It’s a valuation of a specific data set over a given period. When we say ‘moving,’ it denotes the continual recalculation of the data set accounting for the new data as it becomes available. It plays a significant role in the world of financial trading and is a key element for crypto trading.
We’re dealing with a number: the moving average, which represents the average value of a specific cryptocurrency over the established time frame. For instance, a 50-day moving average would calculate the average price of a crypto asset over the last 50 days.
Why does the moving average matter? That’s a worthy question. In short, moving averages help to smooth out the ‘noise’ of the market. By observing the values over time and displaying them as a simple line on a chart, we can more readily identify the general direction of a crypto asset’s price performance.
Consider this: single data points can be volatile, prone to sudden shifts due to market forces. However, when you compile these points into a moving average, the line produced is far smoother, revealing trends and patterns that would otherwise be hidden.
Moving averages are frequently used instruments in crypto trading for various reasons. Here are a few:
- Detecting trends: Moving averages can offer clues for potential uptrends or downtrends, serving as a signal for traders to buy or sell.
- Confirming signal: When a cryptocurrency’s price crosses its moving average, it can confirm whether a new trend is in place.
- Serving as support or resistance: For some traders, moving averages can act as potential price floors or ceilings.
In essence, the moving average serves as a simple tool enabling traders to make more informed decisions when navigating the intricate landscape of crypto trading.
Different Types of Moving Averages Explained
It’s essential to understand that there’s more than one type of moving average traders use in the crypto market. Each holds its unique attributes, and, depending on the trader’s strategy and outlook, one might be more suitable than the other. The three most common types of moving averages are Simple Moving Average (SMA), Weighted Moving Average (WMA), and Exponential Moving Average (EMA).
Simple Moving Average (SMA)
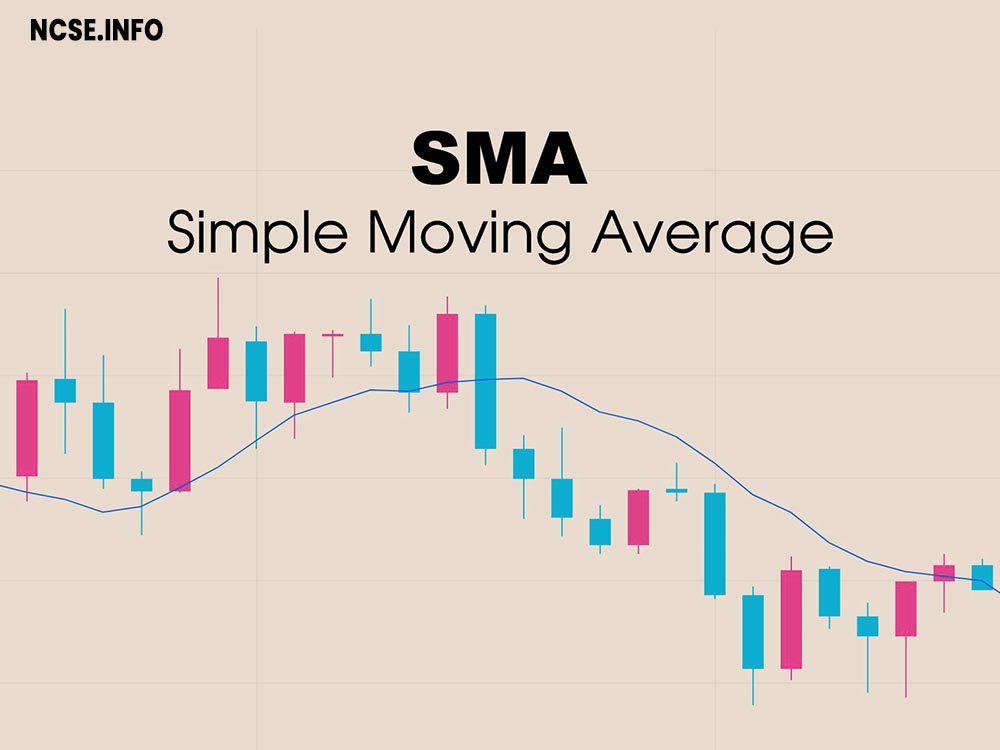
The Simple Moving Average, or SMA, is easily the most basic form of the moving averages. It calculates the average price over a certain number of periods and then plots it on a chart. It’s created by adding up the closing prices over a specific number of periods and then dividing this sum by the number of periods.
SMA = (Sum of closing prices of ‘n’ periods) / n
The key advantage of the SMA is its simplicity, making it easier for beginners to understand and utilize. However, a significant drawback is that it can lag behind the current price because it equally weighs all data points.
Weighted Moving Average (WMA)
The Weighted Moving Average, or WMA, assigns more weight to recent data points, meaning recent prices have a more significant impact on WMA compared to older prices. This weighting can provide a more accurate snapshot of the underlying trend, especially in volatile markets like crypto trading.
WMA = (Sum of (Closing Price x weighting factor)) / (Sum of weighting factor)
While WMA provides a more responsive picture of the market situation, it can be a bit complex to calculate, particularly for beginners.
Exponential Moving Average (EMA)
Lastly, the Exponential Moving Average, or EMA, is similar to the WMA in that it assigns more weight to recent data points. However, it uses a slightly different formula to calculate this weight, which results in an even quicker reaction to price changes compared to the WMA.
EMA = (Close – previous EMA) * (2/(N+1)) + previous EMA
The EMA is favored by many advanced traders because it can adapt quickly to price volatility, which is frequent in crypto markets. On the flip side, it can create a lot of signal noise and may result in false positives, particularly during erratic price movements.
In summary, each of these moving averages serves a distinct purpose and is coded differently. They provide various perspectives on the market trend, which can be helpful to a crypto trader looking to identify valuable trading opportunities.

Using Moving Averages to Identify Trends in Crypto Markets
It’s not uncommon for crypto market enthusiasts to be thrown into a wave of fluctuating prices. As much as the volatility provides lucrative opportunities, it can equally be a source of financial setbacks. This is where moving averages come in, acting as a stabilizer to help identify clear market trends amidst the volatile crypto market landscape. But how do they do this? Let’s take a look.
Firstly, moving averages enable traders to smooth out price data, reducing the ‘noise’ and distractions caused by the inherent volatility of crypto prices. By calculating the average price over a designated timeframe, moving averages present a simple line on the price chart, offering a clear visual representation of the broader price trend. Whether Bitcoin is in a bullish (upward) trend or a bearish (downward) trend, the moving average keeps you informed.
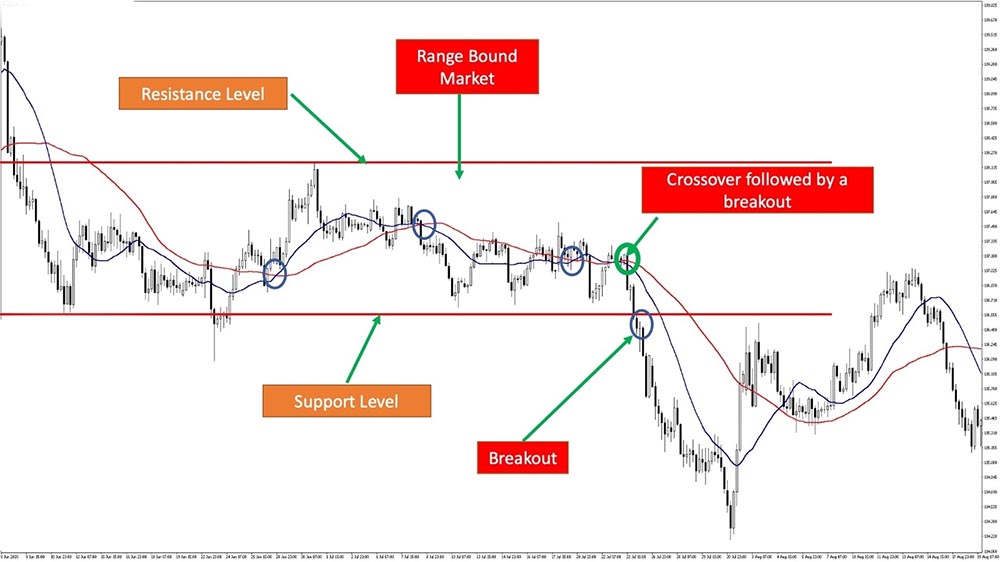
Secondly, moving averages provide support and resistance levels. Imagine a situation where the price of Ethereum struggles to rise above a certain level – that becomes a resistance level. Conversely, if it can’t seem to drop below a certain point, that becomes a support level. Traders may use these markers to make buying or selling decisions.
There are different ways in which moving averages can relay this information:
- Crossovers: A crossover occurs when a short-term moving average (like the 50-day SMA) crosses a long-term moving average (such as the 200-day SMA). A bullish crossover (also known as a ‘Golden Cross’) happens when the short-term moving average crosses above the long-term moving average, usually signaling an upward price trend. Conversely, a bearish crossover (or ‘Death Cross’) occurs when the short-term moving average crosses below the long-term average, suggesting a potential downward trend.
- Price and moving average: The crypto currency’s price relative to its moving average can also provide hints about potential upward or downward trends. If a currency’s price is above the moving average line, it generally signifies a bullish trend, while a price beneath the moving average often signals a bearish scenario.
Reading the moving averages correctly can be a powerful tool in a trader’s repertoire, enabling a predictive approach to market trends. Next, we’ll explore some of the advantages and disadvantages of using moving averages in crypto trading.
The Pros and Cons of Using Moving Averages in Crypto Trading
Just as with any strategy or tool employed in crypto trading, moving averages come with their own unique sets of advantages and disadvantages. Without understanding both sides of the coin, it’s far too easy to dive into interpretation and application blind, which can lead to devastating losses in this high-stakes world of digital assets. Therefore, it’s imperative that both the pros and cons are explored in detail.
The Pros of Using Moving Averages in Crypto Trading
-
Identifying trends: This is undeniably the most significant benefit of using moving averages. This tool can highlight the upward or downward trajectory of a crypto asset’s price over a specific timeframe, making it simpler to grasp the overall trend.
-
Simplicity: Even for beginners, moving averages are relatively easy to calculate and understand. In crypto trading, where volatility is the norm and markets can change rapidly, a tool that offers straightforward insights is valuable.
-
Filtering noise: Price fluctuations in crypto markets can be triggered by a range of factors. Moving averages help filter out temporary or minor price changes, providing a smoother line that’s easier to analyze.
-
Flexibility: By altering the timeframe used in the calculation, traders can adjust the sensitivity of moving averages. This flexibility allows each trader to use moving averages in a way that suits their individual trading style and risk tolerance.
The Cons of Using Moving Averages in Crypto Trading
-
Lagging indicator: Because moving averages are based on past prices, they’re inherently lagging indicators. This means that moving averages might not accurately reflect current market conditions, particularly in volatile crypto markets.
-
False signals: While moving averages can show trends, they can also produce false signals, particularly in choppy markets. For instance, a temporary price change could look like a trend reversal.
-
Limitation in identifying price levels: Although moving averages can help identify trends, they aren’t as useful for pinpointing exact price levels to execute trades. This requires additional analysis using other chart patterns or technical indicators.
In conclusion, while moving averages are a valuable tool in the crypto trader’s toolkit, they aren’t infallible. By understanding the associated pros and cons, traders can utilize these tools with more confidence, leveraging their strengths and compensating for their weaknesses with other market analysis tactics.
Real-world Examples: How Moving Averages Can Help You Make Informed Crypto Trading Decisions
The intuition behind moving averages is simple, but to truly appreciate their value, it’s critical to view them in action. Here are a few real-world examples of how moving averages can aid in making informed crypto trading decisions.
Bitcoin (BTC) 50-Day & 200-Day SMA
During Bitcoin’s unforgettable bull run in 2017, savvy traders found a roadmap in the form of its 50-day and 200-day simple moving average (SMA). The 50-day SMA worked as a dynamic support level throughout the year, illustrating an ongoing uptrend. When the price of Bitcoin crossed below the 50-day SMA for the first time in September, it signaled a potential trend reversal. But the 200-day SMA held strong as a support line, signalling an excellent buying opportunity for traders since the price resumed its uptrend soon after.
Note: Always remember, the price crossing above the moving average does not guarantee an uptrend or crossing below does not confirm a downtrend. It should be used in conjunction with other trading tools and indicators.
Ethereum (ETH) & the 21-Day Exponential Moving Average (EMA)
In the case of Ethereum during early December 2020, the 21-Day Exponential Moving Average served as a critical line of support. The price remained above it during the bull run, with each test of the EMA met by buyers stepping in. When the price finally broke below the 21-day EMA in late February, it suggested a potential change in trend. This price action afforded traders an opportunity to take advantage of a pullback or consider reducing their positions to protect their profits.
RSI Divergence in Litecoin (LTC)
In July 2019, Litecoin displayed a bearish divergence between its price and the Relative Strength Index (RSI), a popular momentum indicator that often complements moving averages. While the price was advancing, the RSI was declining, hinting that the upward trend was losing strength. This divergence, combined with a drop below the 50-day SMA for the first time since February 2019, suggested imminent downside—and indeed, the price dropped 50% in the following month.
In conclusion, while moving averages don’t forecast the future, they provide essential insights into current market momentum, which, coupled with other technical indicators such as RSI and MACD, can significantly increase the probability of successful trade execution. Whether you’re a seasoned trader or a novice, incorporating moving averages into your trading strategy could offer an edge in the dynamic world of crypto trading.
It is a calculation that helps smooth out price data over a specified period of time.


