RSI Indicator for Boost Your Crypto Trading Profits

If you’re someone who enjoys the thrill of crypto trading, then you’ve likely come across the term ‘RSI Indicator’. This popular technical analysis tool is a must-know for anyone serious about understanding market trends and making informed trading decisions. But what does RSI mean, exactly? And more importantly, how can you use it effectively in your own trading strategy? We’re here to break it all down for you.
RSI, or Relative Strength Index, is a momentum oscillator that measures the speed and change of price movements. Created by J. Welles Wilder, it has become an integral part of charting and analysis tools used in financial trading.
“RSI is calculated using the formula: RSI = 100 – (100 / (1 + RS)). Where RS is the average gain of up periods divided by the average loss of down periods over a specified time frame. Values range between 0 and 100, with high values indicating overbought conditions and low values indicating oversold conditions.”
By understanding the RSI, you can get a sense of when a cryptocurrency might be overbought (and due for a price drop) or oversold (and ripe for a price increase). This insight can be immensely valuable in helping you time your trades perfectly. In the rest of this article, we’ll delve deeper into the mechanisms of the RSI and provide you with practical examples of how it can be used in crypto trading.
Table of Contents

Understanding the RSI Indicator: A Powerful Tool for Crypto Traders
In the volatile world of crypto trading, having a reliable technical analysis tool can greatly reduce the risk. One such instrument is the Relative Strength Index (RSI). It’s a momentum oscillator that measures the speed and change of price movements. The RSI enables traders to identify overbought and oversold conditions in the market, which are potential signals for buying or selling a cryptocurrency.
How RSI Works
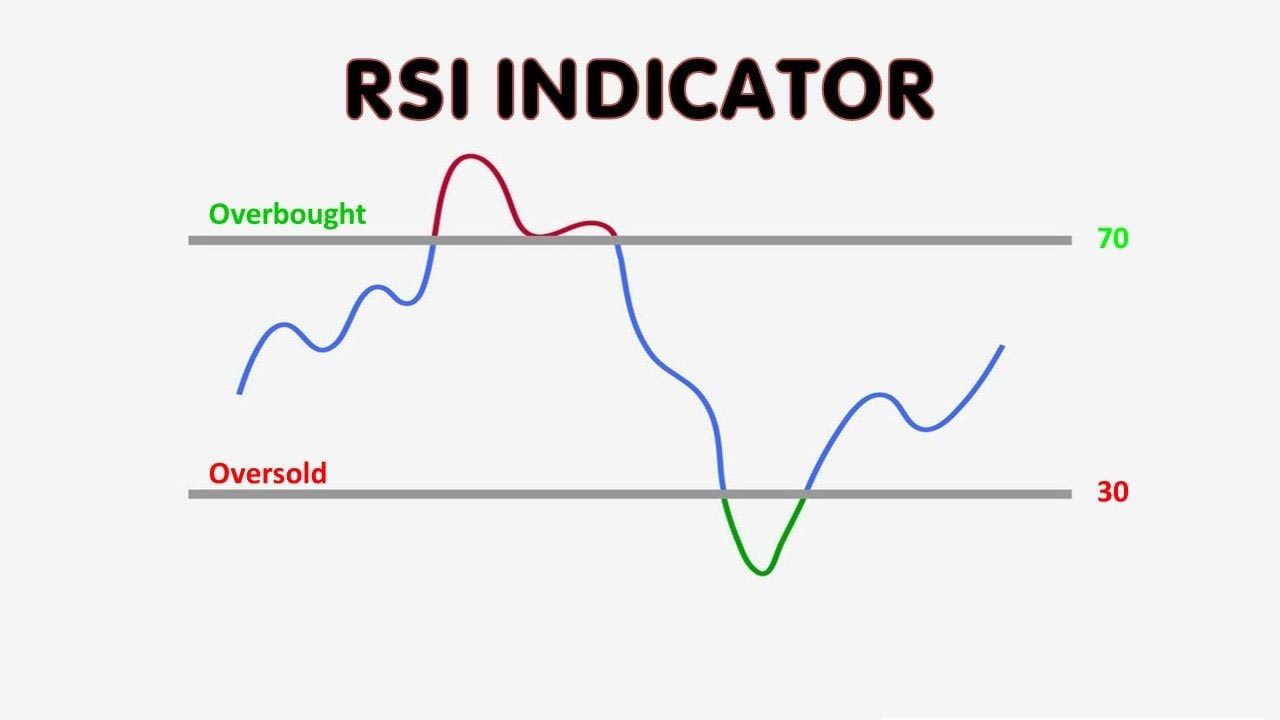
The RSI, developed by J. Welles Wilder in 1978, operates on a scale of 0 to 100. An asset is considered overbought when its RSI surpasses 70, indicating possible impending sell-off. Conversely, an RSI below 30 signals that an asset might be oversold, suggesting the possibility of a price bounce or rally. Essentially, by comparing the magnitude of recent gains to recent losses, the RSI provides trader’s with a gauge of market sentiment about a particular cryptocurrency.
RSI and Cryptocurrencies
Crypto traders have found the RSI particularly effective due to the nature of the market. As cryptocurrencies are prone to sharp, swift price movements, the RSI can provide valuable alerts of potential reversals or corrections. This can enable traders to either capitalize on opportunities or protect their investment before a major price shift.
Interpreting the RSI
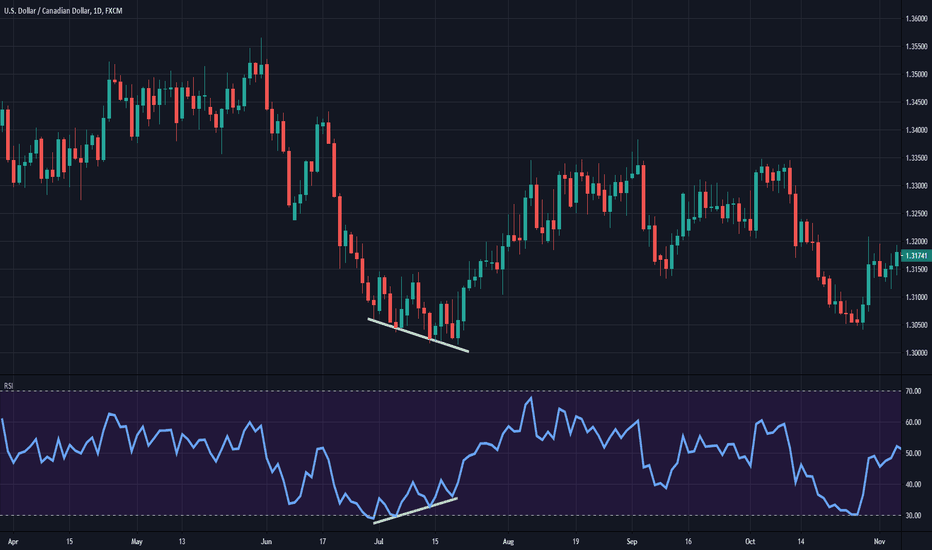
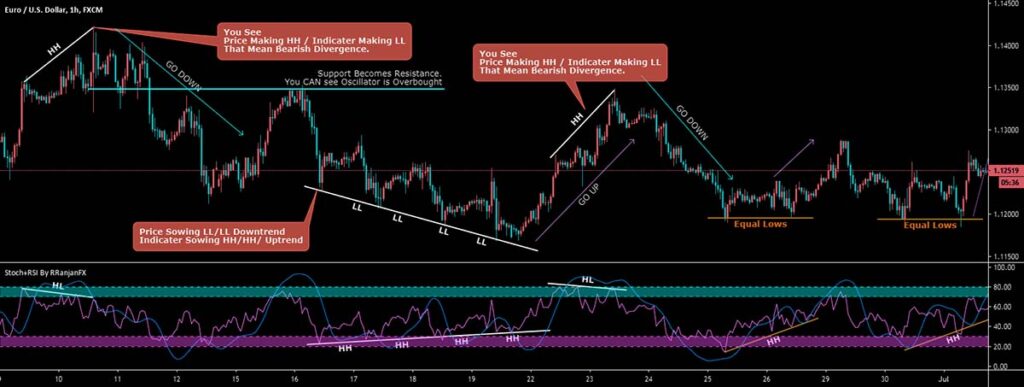
Understanding the RSI is not simply about recognizing when it crosses the 70 or 30 threshold. Those familiar with the RSI know that it’s critical to recognize the formation of graphical patterns and divergence. This refers to instances where the market price moves in the opposite direction to the RSI, signaling an impending market reversal.
In the hands of an educated trader, the RSI is a powerful tool for navigating the crypto markets. It offers a method to potentially identify lucrative trading opportunities and manage trading decisions more efficiently. However, experiencing success with the RSI requires practice and a comprehensive understanding of its workings.

Unlocking the RSI Formula: Calculating and Interpreting RSI Values
For any trader to maximally leverage the power of the RSI, wrapping one’s head around the RSI formula is indispensable. Essentially, the RSI is a mathematical means to measure the speed and change of price movements. The formula for this calculation appears complex at glance but it does have a straightforward interpretation once broken down.
RSI Formula Essentials
The formula for RSI can be expressed as:
RSI = 100 – (100 / 1 + RS)
Where:
- RS stands for Relative Strength, calculated as the average gain divided by the average loss.
- The Average Gain and Average Loss are calculated over a specific period, generally 14 periods as default.
Calculating RSI: Step-by-Step
The process of calculating RSI can be broken down into a series of steps:
- Calculate the individual price changes for each period.
- If the current closing price is higher than the previous, it’s considered as a gain (else, a loss).
- Calculate average gain and loss over the RSI period determined (default is generally 14 periods).
- Calculate the relative strength (RS), which is the average gain divided by the average loss.
- Finally, apply the RS value into the RSI formula to get the RSI value.
Interpreting RSI Values
Ranging from 0 to 100, RSI values can provide useful insights into market conditions:
- A value above 70 suggests an overbought condition, indicating a potential sell signal.
- On the other hand, a value below 30 implies an oversold condition, pointing to a potential buy signal.
- A value at or around 50 usually indicates no clear trend.
- More nuanced strategies might use other thresholds (like 80/20 or 85/15) to refine their signals further.
In a nutshell, understanding how to calculate and interpret RSI values can give traders a powerful tool to predict potential turning points in the marketplace. This knowledge allows for more informed decision-making and can greatly refine a trader’s strategy in the volatile world of cryptocurrency trading.
RSI Strategies for Entry and Exit Points: Timing Your Trades with Precision
The success of trading in the crypto market significantly depends upon precision—the ability to enter and exit the market at optimal points. The Relative Strength Index (RSI) serves as a valuable tool in refining this timing, providing traders with a potent strategy for identifying entry and exit points with high levels of precision. This section explores the effective utilization of RSI within crypto market trading with a focus on timing your trades.
Identifying Overbought and Oversold Conditions
One of the key signals that RSI provides to traders is the identification of overbought and oversold conditions. A cryptocurrency is considered overbought when its RSI score is above 70, indicating that it might be getting overvalued and could be primed for a price pullback. Conversely, a cryptocurrency is deemed oversold if its RSI falls under 30, suggesting that it might be undervalued and possibly poised for a price jump. Traders can strategically plan their entry and exit points based on these RSI thresholds:
RSI Breakouts: Capitalizing on Strong Price Movements in Cryptocurrencies
The Relative Strength Index (RSI) can play a crucial role in identifying powerful price movements, or breakouts, in the volatile crypto market. These breakouts often represent significant buying or selling activity that can dictate the short-term direction of a cryptocurrency.
What is a RSI Breakout?
An RSI breakout is a scenario when the RSI line breaks through a critical level, usually 30 (oversold) or 70 (overbought), or when it breaks through a trendline drawn over its chart. These breakouts typically indicate that the underlying momentum of a cryptocurrency is strong enough to perpetuate a significant move in the price. In simpler terms, a high RSI value implies a strong upward price momentum, expected to breakout to the upside, whereas a low RSI value indicates a strong downward price momentum, likely to break to the downside.
Identifying RSI Breakouts
Identifying an RSI breakout requires the trader to carefully watch the RSI levels and trendlines. The key factors to consider include:
- RSI Level: Oversold or overbought conditions, as indicated by the RSI crossing below 30 or above 70, are typical breakout points. This indicates a reversal in price may be imminent.
- Trendline Break: In some instances, the RSI forms recognizable patterns with trendlines. A breakout occurs when the RSI line crosses a trendline, indicating a potential reversal or continuation of the current trend.
- Divergence: Crypto traders also perceive a divergence between price and RSI as an indicator of a potential breakout. That’s when price is making higher highs, but RSI isn’t, or when price is making lower lows, but RSI isn’t.
Note: While these are reliable signals, they should not be used in isolation. Confirmations from other indicators or chart patterns increase the likelihood of successful trades.
Betting On RSI Breakouts
Capitalizing on RSI breakouts, like any other trading strategy, requires careful analysis and risk management. Once a potential breakout scenario is identified, a trader might decide to enter a long position if they expect the price to rise further, or a short position if they anticipate a price drop. However, it is essential to remember that while RSI breakouts can be profitable, they also carry substantial risk due to the highly volatile nature of cryptocurrencies.
To counter this volatility and reduce the risk of loss, traders may consider setting stop-loss orders at strategic points just beyond the breakout point. Additionally, taking profits when the RSI reaches extreme levels can help lock in gains and guard against potential price reversals.
RSI as a Confirmation Tool: Validating Trading Signals for Better Accuracy
The Relative Strength Index (RSI) is not only a standalone tool but can also be utilized as a valuable mechanism to confirm trading signals, thus enhancing your accuracy in the volatile world of cryptocurrency trading. This section discusses how to use RSI as a confirmation tool.
Reinforcing Trading Signals with RSI
RSI can bolster the reliability of signals from other technical analysis tools. These tools might include Moving Average Convergence Divergence (MACD) or Bollinger Bands. When RSI aligns with these indicators, it provides further evidence of potential buying or selling opportunities.
RSI Divergence: A Powerful Confirmation Tool
A particularly effective strategy involves observing what is known as ‘RSI divergence’. This arises when the price of a cryptocurrency and the RSI move in opposite directions. Specifically, if the price reaches new highs while RSI fails to surpass its previous high, this scenario exhibits a ‘bearish divergence’. Conversely, if the price falls to new lows but RSI doesn’t reach its previous low, it’s known as a ‘bullish divergence’.
Tip: RSI divergence is an important indicator, and traders must pay close attention to these patterns. While it doesn’t guarantee a price reversal, it suggests the current trend may be losing momentum and a reversal could be imminent.
Interplay between RSI and Trend Lines
In addition to divergence, you can use the RSI to validate trend lines in the price chart. If RSI and the trend line on the price chart are in sync, there’s a stronger case for the existing trend persistence. Hence, you can use this confluence to place trades with enhanced conviction.
RSI Crossover as a Confirmation Signal
The 50-line crossover is another popular method where RSI can serve as a confirmation tool. When RSI crosses above or dips below the 50-line, it can confirm bullish or bearish market sentiments, respectively. However, while the 50-line crossover can be a helpful confirmation signal, it’s crucial to understand that due to frequent fluctuations in crypto prices, these signals should be used in conjunction with other technical indicators for maximum accuracy.
To sum it up, using the RSI as a confirmation tool can provide valuable insights and complement your trading strategies, leading to improved decision making in the dynamic crypto trading marketplace.
RSI Tips and Tricks: Expert Insights for Maximizing Your Trading Potential
As a tried-and-true resource for traders, the Relative Strength Index (RSI) stands as a powerful tool. With the right approach, it can assist in assessing the market conditions, prompting profitable entry and exit points, and thereby handing you the keys to maximizing your trading potential. Let’s dive into some throughput strategies to elevate your understanding of RSI.
Understanding Historical RSI Patterns
Analysts frequently consider the RSI alongside its historical patterns – and rightly so. When working with RSI, it’s not enough to consider the present readings in isolation: you must also study the past. Seeing when the RSI has dipped into overbought or oversold territories previously can provide better insights into potential price action and volatility.
Leveraging RSI in Sideways Markets
In a slightly stagnant market where price is moving within a rigid range – referred to as a ‘sideways market’ – the RSI can also prove to be a useful ally. As oscillators, tools like the RSI were created to operate optimally in these conditions. By remaining vigilant about when the RSI dips or surges outside 30 or 70, respectively, traders can identify optimal moments to purchase or sell.
Utilizing RSI along with other Indicators
The RSI is exhaustive, but not omniscient. For a well-rounded trading strategy, consider using RSI in tandem with other technical indicators. For instance, taking into account trend lines, Moving Average Convergence Divergence (MACD), or Bollinger Bands along with the RSI can lend additional credence to your strategy.
Setting your own RSI Thresholds
While the traditional thresholds of 30 and 70 may be a solid starting point, it should be emphasized that they aren’t set in stone. Depending on the asset’s behavior and other market conditions, you might find that setting your own RSI boundaries – say, 20 and 80, or 25 and 75 – may yield a more accurate prediction.
RSI in Conjunction with Chart Patterns
Use price pattern recognition alongside the RSI for validating trade decisions. Chart patterns such as the ‘double top’, ‘head and shoulders’, ‘triangles’, or ‘flags’ can often be corroborated effectively with the RSI to increase trade accuracy. For instance, a bearish price pattern coupled with an overbought RSI reading can provide a strong sell signal.
In summary, the RSI is an exceptional indicator, but its true power and versatility can only be harnessed fully if used judiciously in combination with other techniques and insights. Remember, all indicators, have their limits, and even the RSI won’t guarantee 100% accurate signals. However, it can certainly provide a solid base to your crypto trading journey, helping you navigate the volatile waters of cryptocurrency markets with confidence.
The RSI is used to measure the speed and change of price movements.


